A laboratory recently contacted us because their nightly database optimisation had stopped working. SENAITE LIMS was running fine on the surface. Users logged in, registered samples, entered results, published reports. Nothing in the user interface gave anything away.
Under the hood, the database had been growing unchecked for
months. The scheduled pack operation was silently failing every
night. The cause turned out to be a single corrupted database
record. One truncated object, likely produced when a server
restart interrupted an active write operation. That one bad record
blocked the entire garbage collection process, causing the pack to
abort with an EOFError every time it ran.
The lab found out by accident, three months in, when the disk hit 80% and an unrelated alert fired.
This is the kind of failure proactive monitoring exists to catch.
What proactive monitoring actually means
The temptation with monitoring is to watch the surface: is the HTTP endpoint up, is the disk under 90%. That tells you very little about a LIMS.
A LIMS holds operational data inside a ZODB (Zope Object Database) that grows over time, compacts on schedule, and depends on a few quiet operations that nobody sees succeed because nobody looks. Proactive monitoring watches those operations:
- Did last night’s pack run? Did it complete?
- Did last night’s backup run? Did the restore verification pass?
- Are there ConflictErrors in the log that the user did not see?
- Is any object in the database broken?
- Is the response time degrading? Disk growth accelerating? Worker count saturating?
If you only check whether SENAITE answers HTTP, you find out about problems the day they cause an outage. If you check the five questions above, you find out the night they start.
HealthWatch
We built HealthWatch because we needed exactly this for the labs we support. It runs on your SENAITE server as a small Python service, queries the ZODB and the SENAITE catalogs directly, and emits structured metrics to our central Zabbix monitoring instance.
It watches six areas.
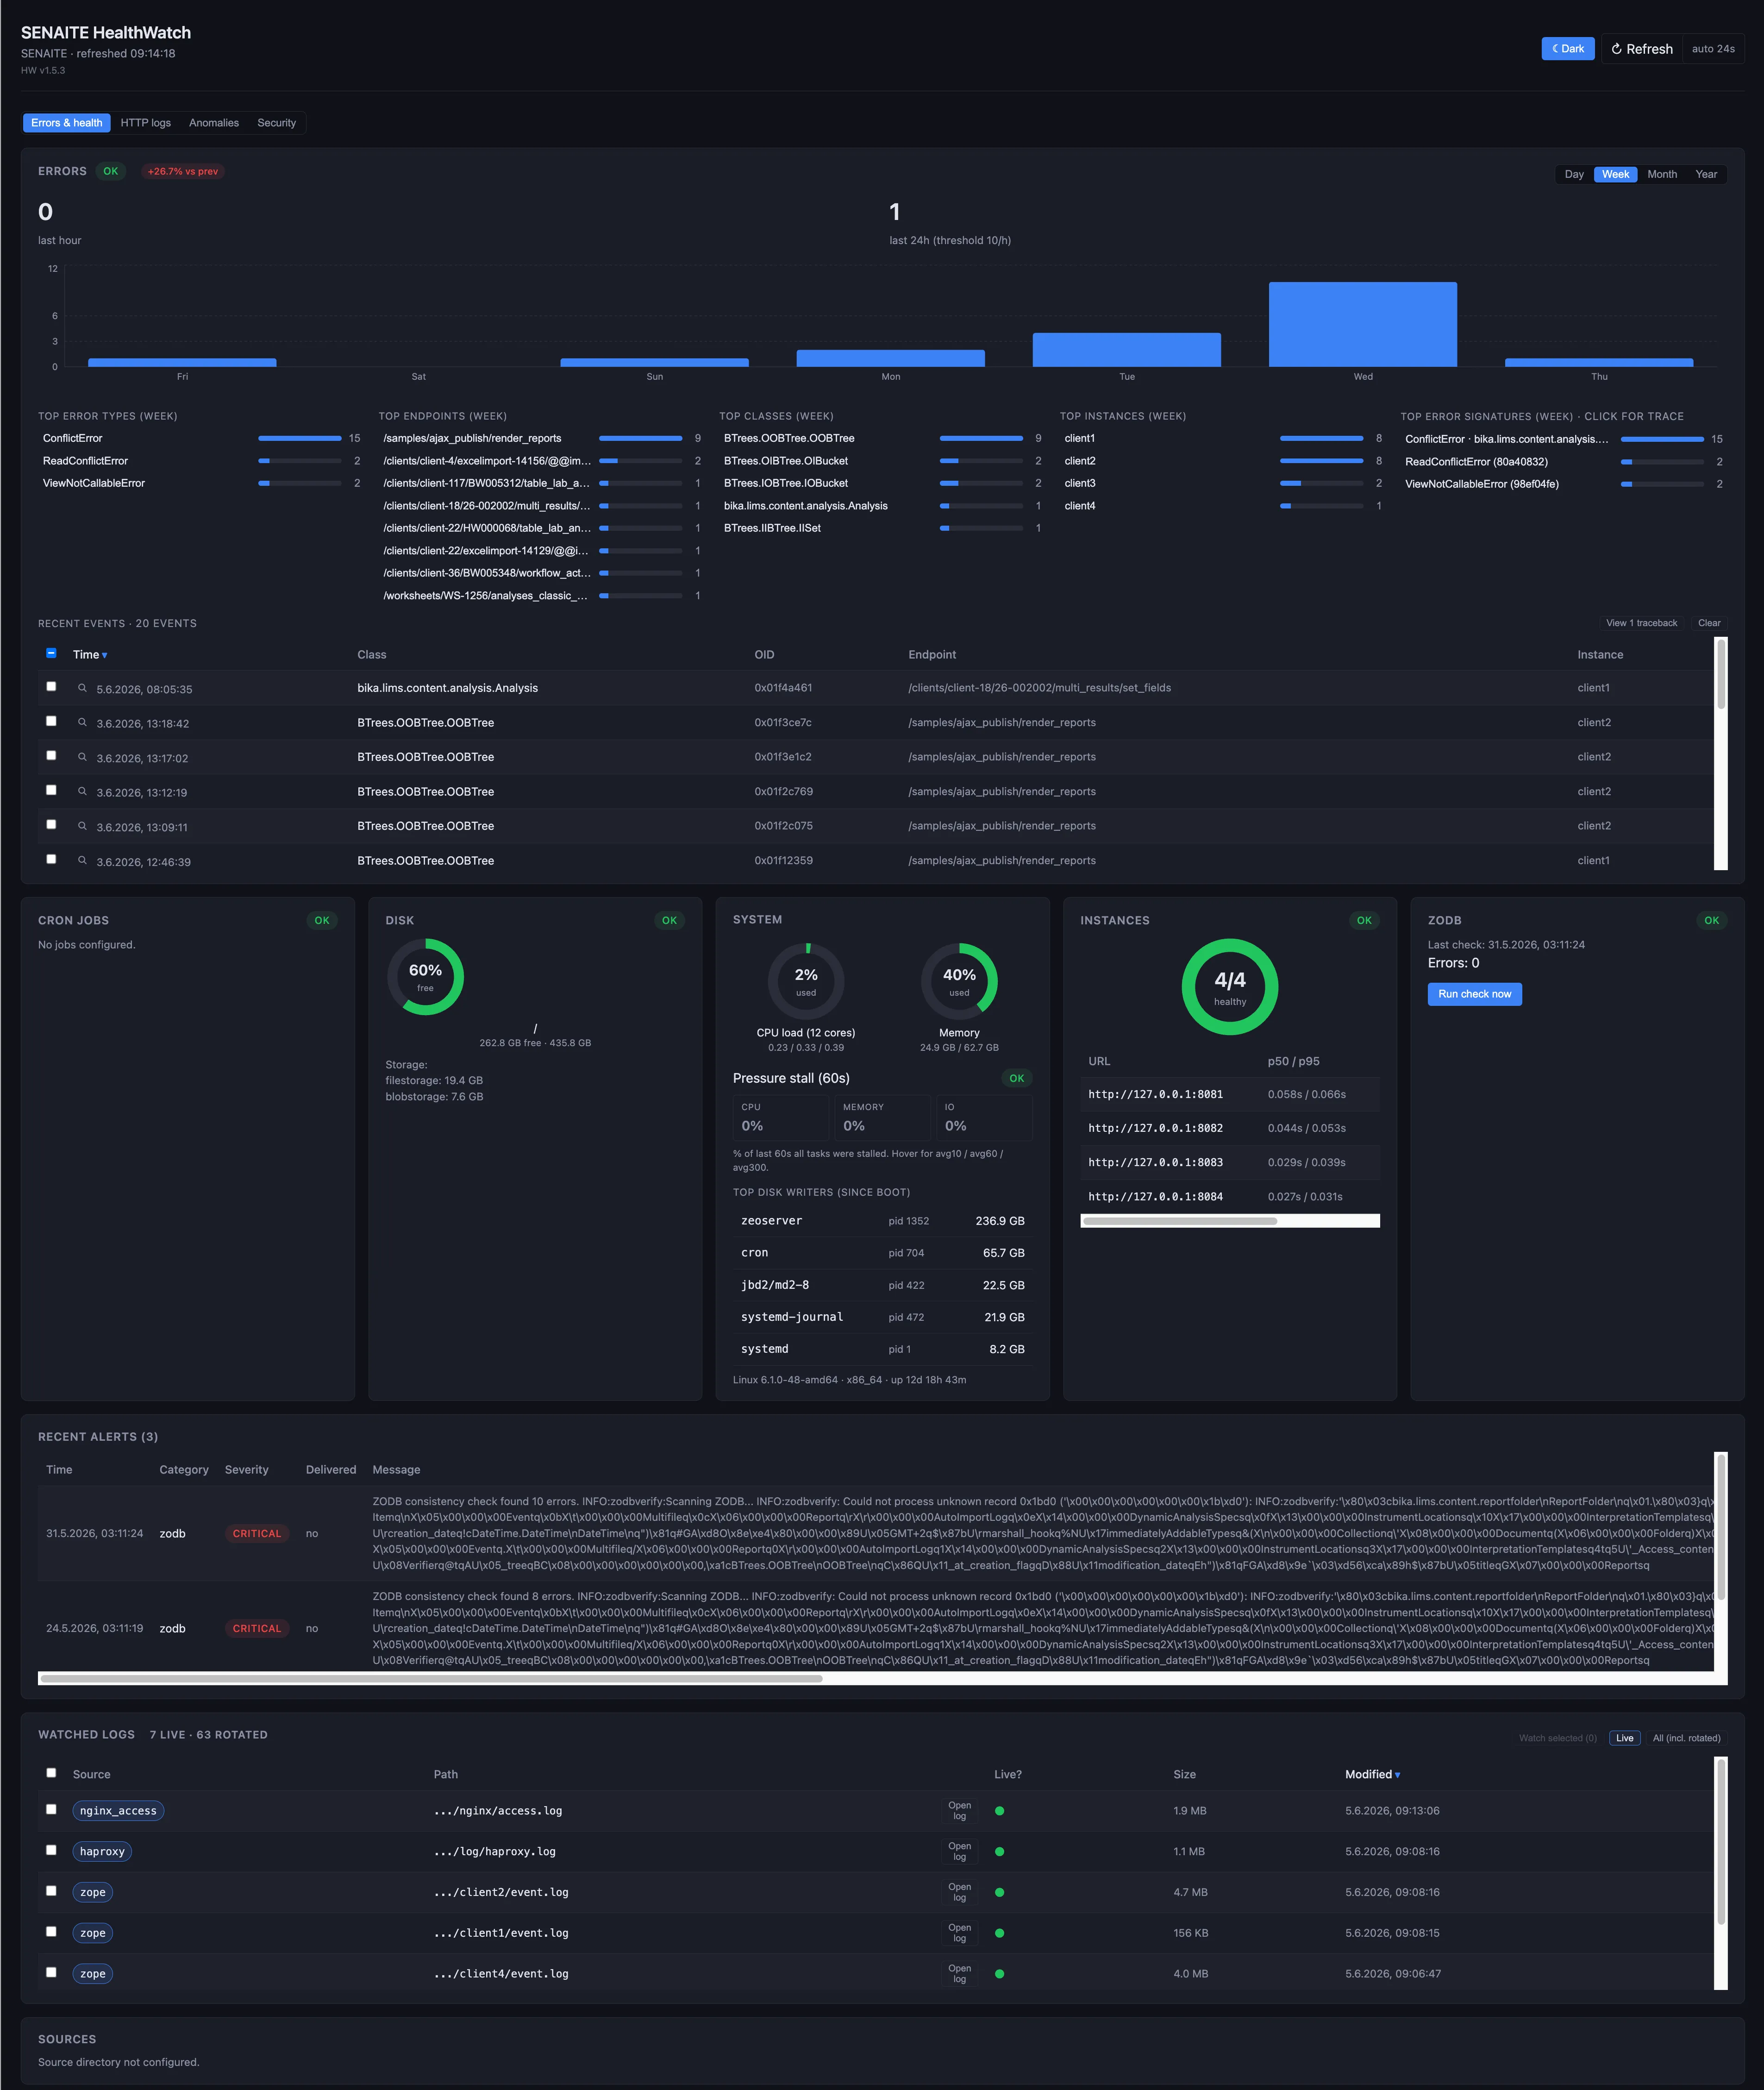
Database consistency
Full ZODB integrity scans on a schedule. ConflictError detection in the event log. Truncated-object detection by walking the object tree and looking for ones that fail to deserialise. The exact failure mode that broke the case above is the first thing it checks.
Instance health
Response times to the Plone front controller. Worker availability. Memory ceiling per worker. Background-task queue depth. The kind of thing that goes wrong gradually, where the lab does not notice the response time creeping up from 200 ms to 4 s until users start emailing the IT manager.
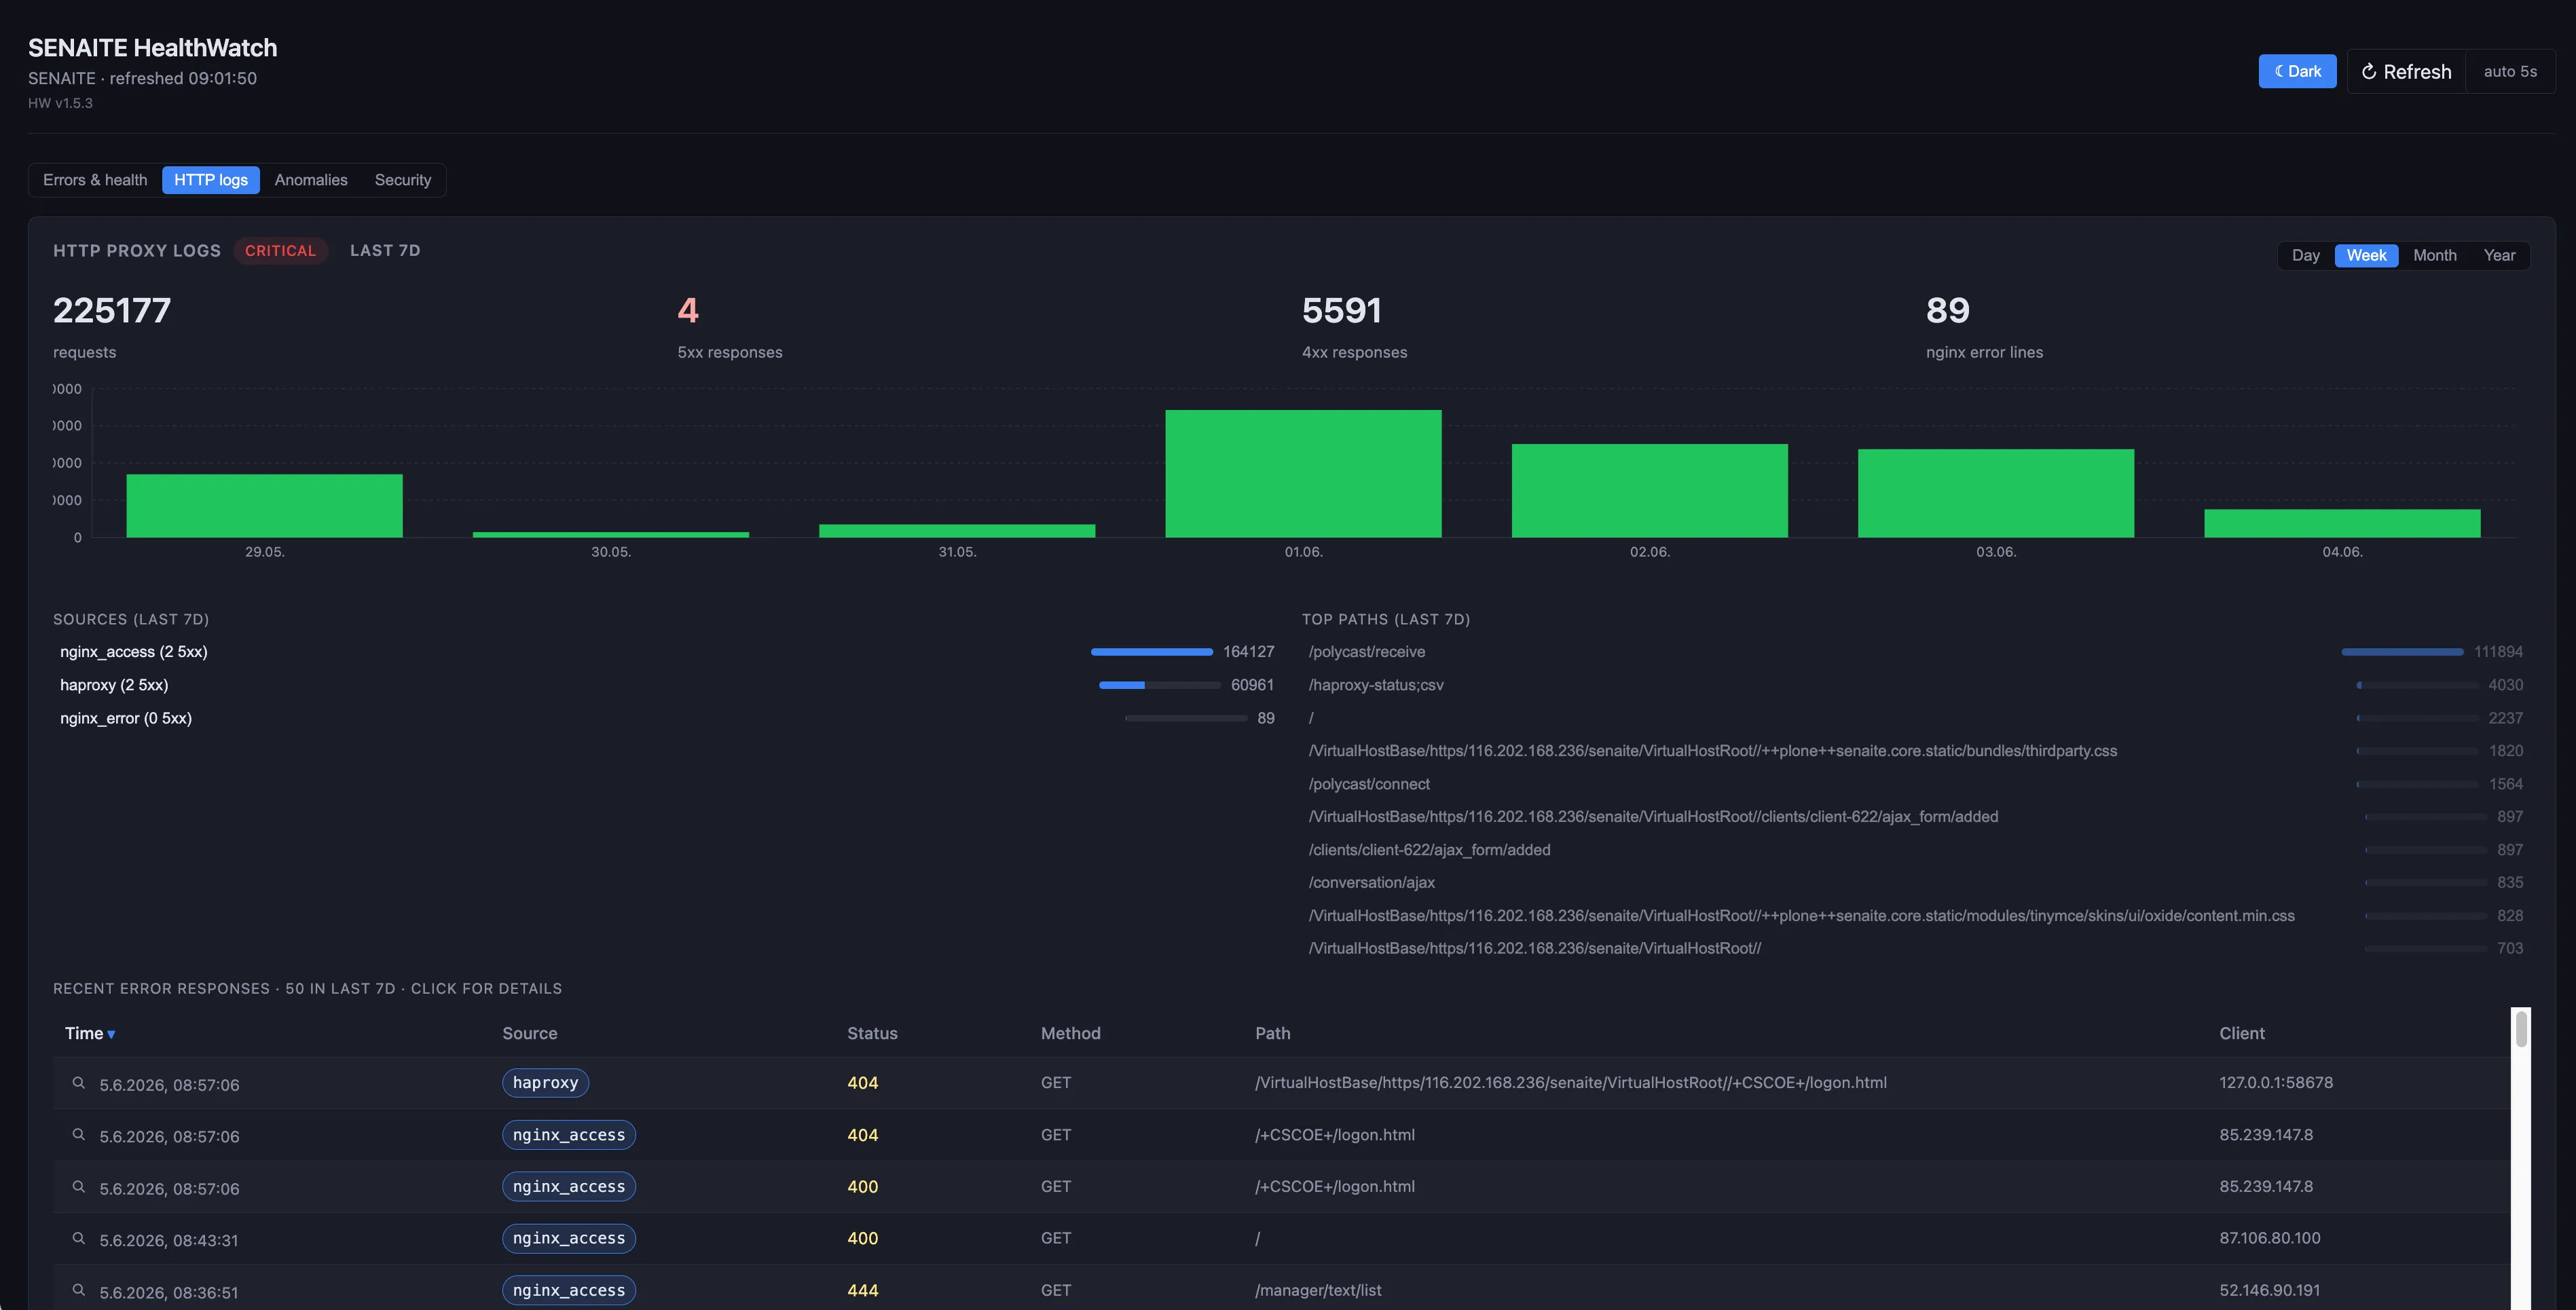
The HTTP-logs view tails both the haproxy access log and the nginx error log, classifies every request by status family, and plots the seven-day trend so a sudden spike in 5xx responses shows up as a green bar that everyone can see. Sources, top paths, and the most recent error responses are listed alongside so you can drill into a regression without leaving the dashboard.
Storage
Data.fs growth rate. Disk-free margin. Backup target size. Pack ratio (how much storage one pack actually reclaims, which tells you whether the pack is doing its job).
Scheduled tasks
ZODB pack, automated backup, cron jobs the lab depends on. Each one reports success or failure on completion. If a scheduled task silently stops running, HealthWatch notices on the next expected window.
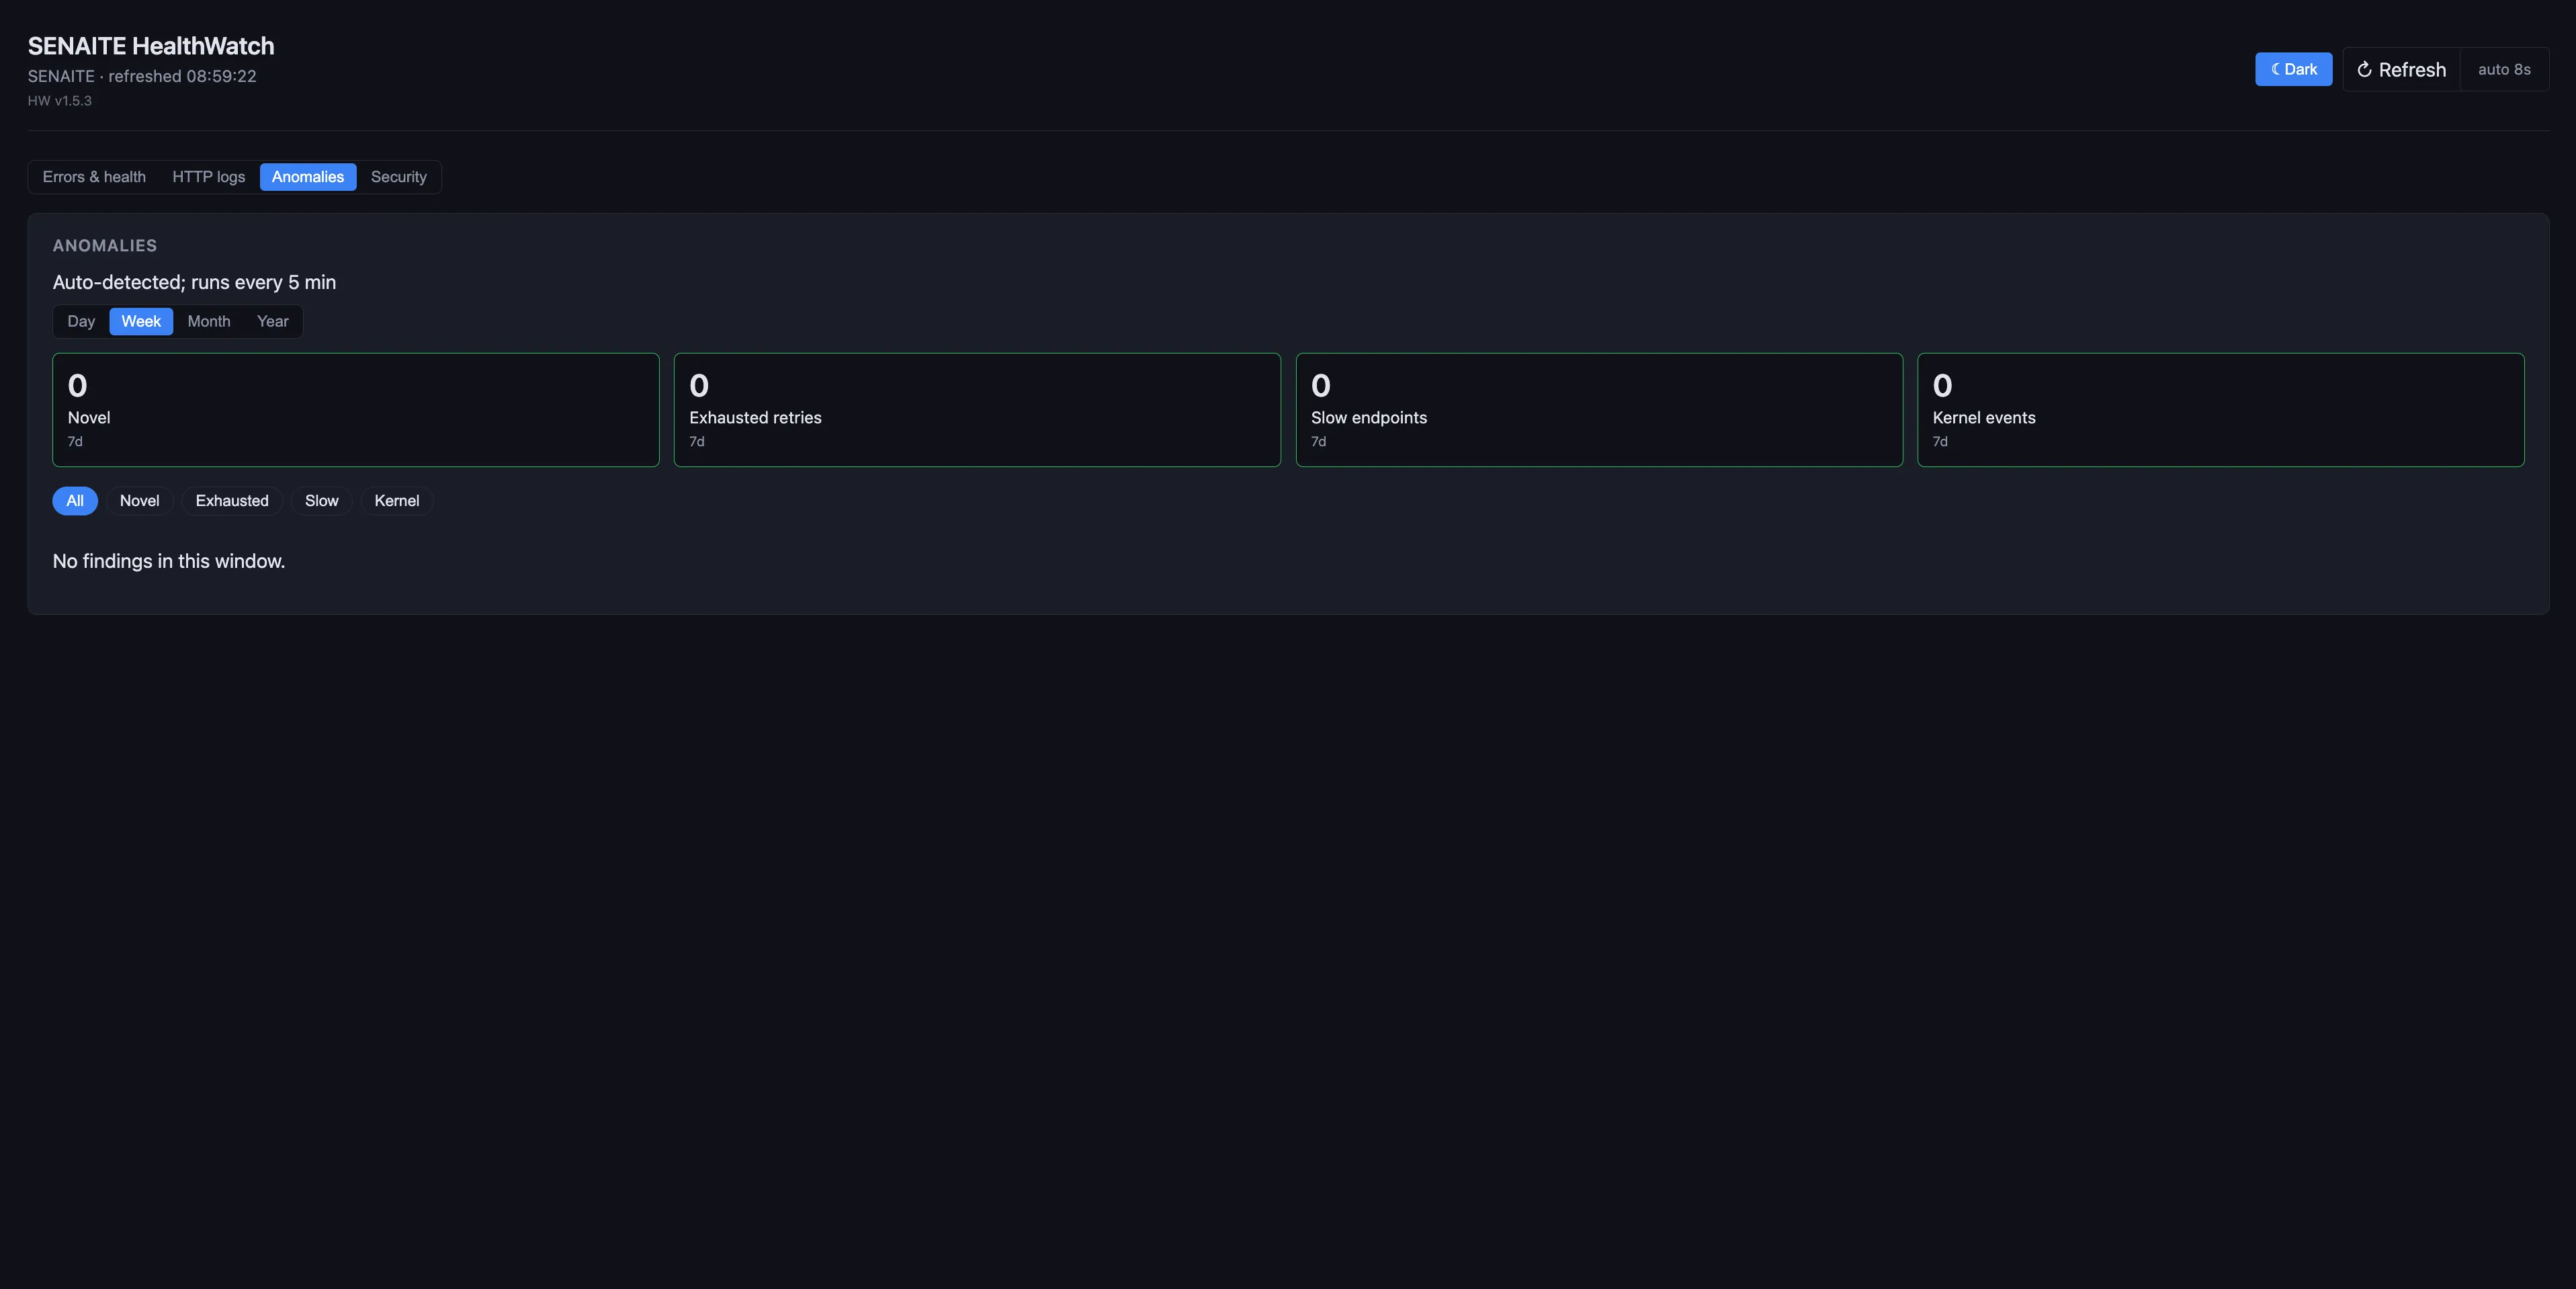
Anomalies
Behaviour that is technically valid but statistically unusual: endpoints whose response time has drifted, a worker that retries the same task to exhaustion, kernel events that suddenly appear on a node that never used to log them, novel error signatures that have not been seen in this codebase before. The Anomalies tab buckets each one into a category (Novel, Exhausted retries, Slow endpoints, Kernel events) and rolls them up over the configured window so you can compare today against the last seven days at a glance.
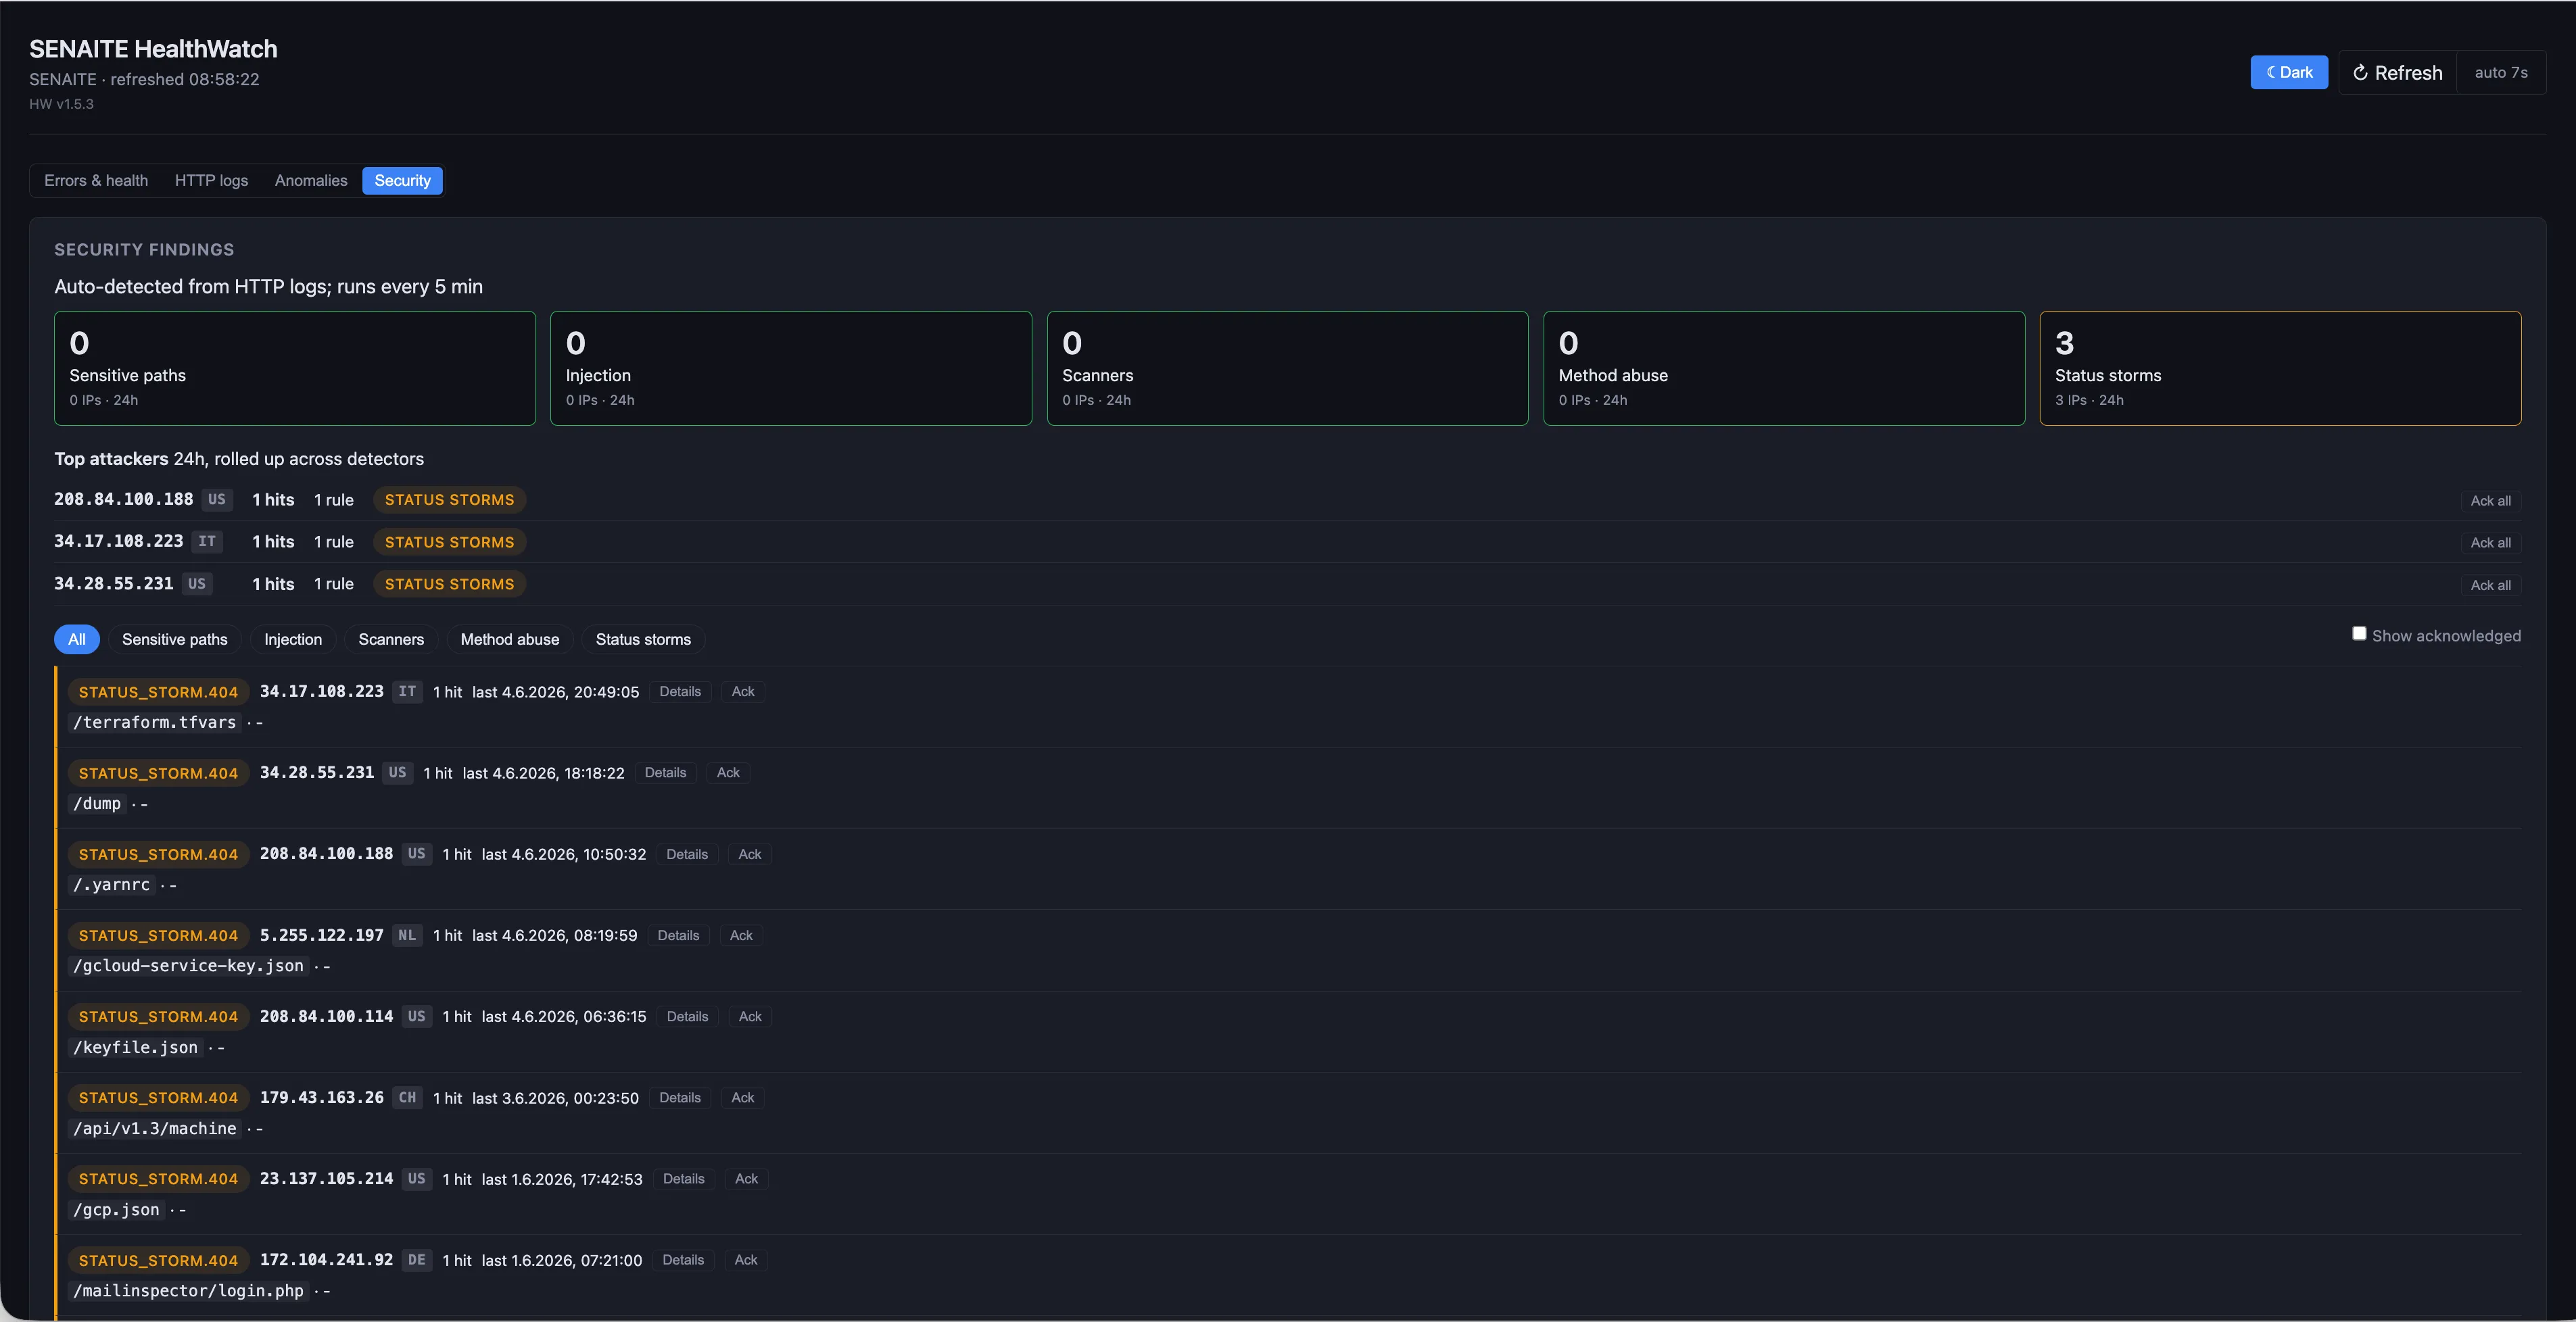
Security
Failed-login throttling, suspicious request patterns, status-code storms hammering paths that should not exist. HealthWatch’s Security tab aggregates the live HTTP log on a five-minute window, classifies each anomaly by category (sensitive paths, injection attempts, scanners, method abuse, status storms), and surfaces the top attackers as soon as a threshold trips.
What happens when something fires
HealthWatch alerts forward to our central Zabbix instance. Out-of- hours alerts go to our on-call rotation. In working hours, they go to the team handling that lab’s contract.
For Professional and Enterprise customers, a customer-facing web dashboard surfaces the same data, so the lab’s IT team sees what we see. Enterprise customers get a weekly health report by email.
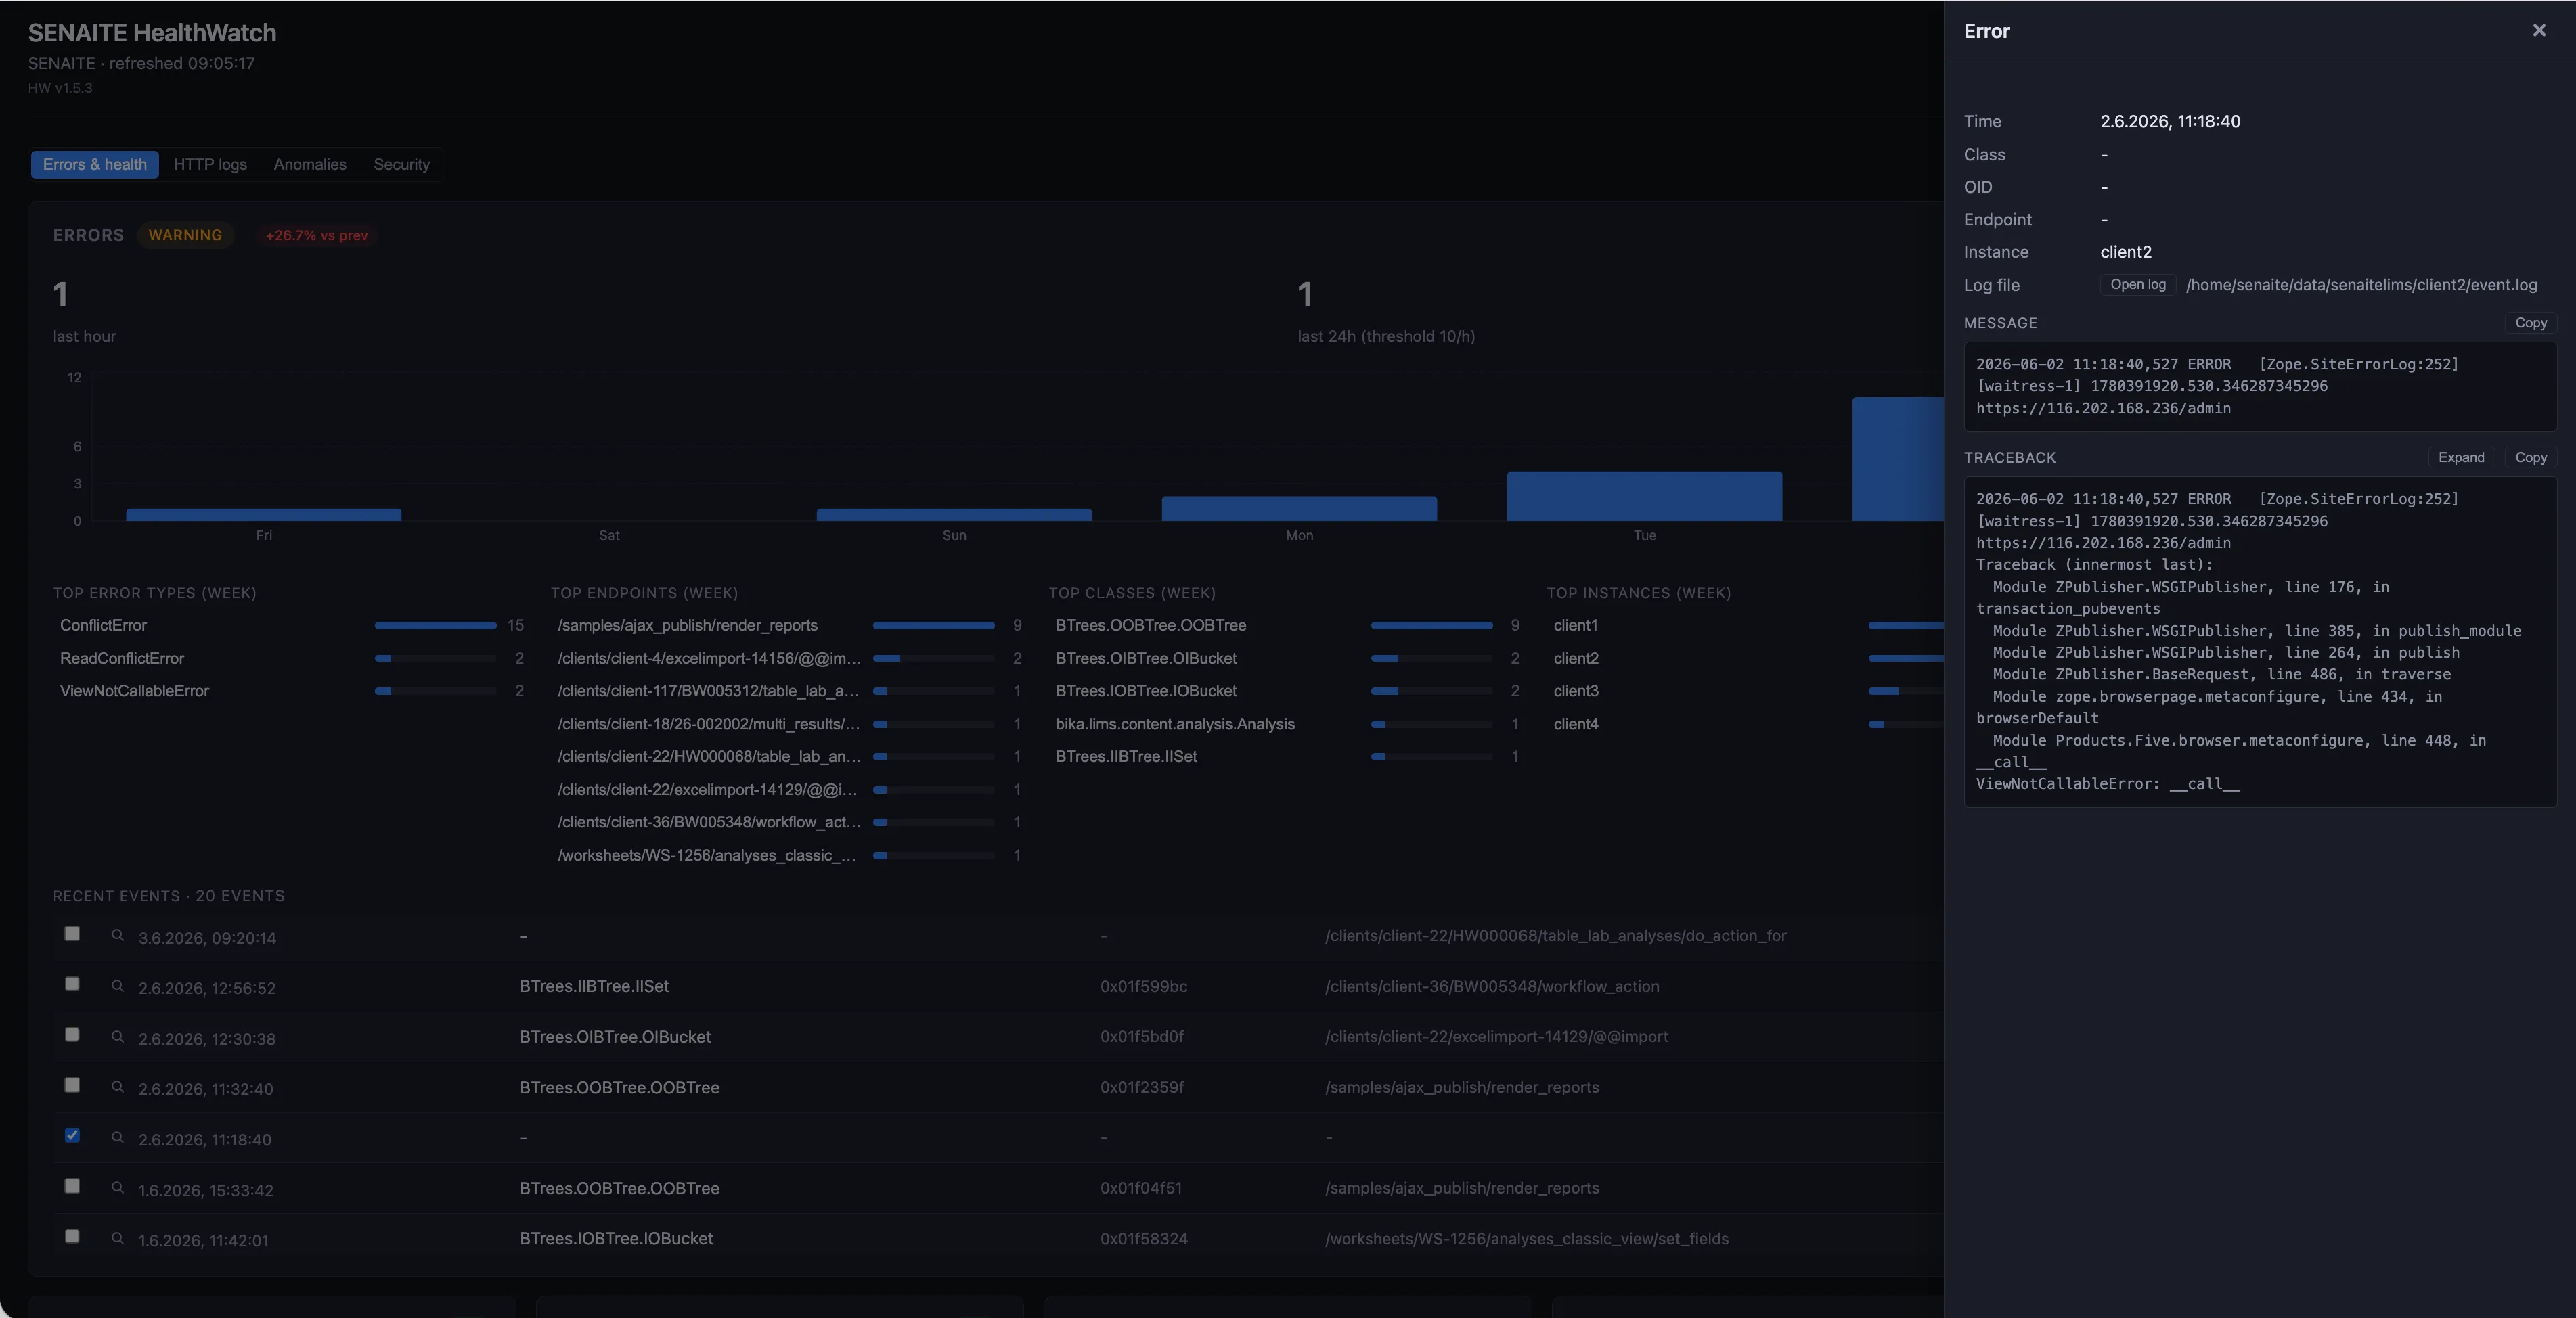
Clicking any event opens a side drawer with the full context: the class, the affected OID, the endpoint, the instance that emitted it, the path of the source log file, the message, and the full Python traceback. Both the message and the traceback are one click away from the clipboard, so the on-call engineer can drop a faithful record into the ticket without grepping through any log files.
Back to the case
For the lab in the story above, the fix was straightforward once we knew what we were looking at. We identified the truncated object via a ZODB walk, repaired the reference, and the next pack ran cleanly. The Data.fs dropped from 8.4 GB back to 2.1 GB overnight. No data loss.
What was less acceptable was the months of growth before anyone noticed. If HealthWatch had been on that server, we would have caught the first failed pack the morning after it failed. That is the whole point.
What this costs
Every SENAITE Care plan includes HealthWatch. The Essential tier starts at EUR 300 per month and covers monitoring, scheduled maintenance, and email support. For most labs running SENAITE in production, this is the right floor.
If you would like to know what we would see on your installation, get in touch. We can run a one-time health audit without committing you to a plan.
What you should do this week
Whether you use HealthWatch or not, three checks worth running on your SENAITE this week:
- Tail the event log for the string
EOFError. If you see it, your pack is probably failing. - Compare
du -shon your Data.fs today with what it was three months ago. A pack that runs reduces it. If the number only grows, your pack is not running. - Try a restore on a recent backup. Find out now whether the backup is restorable, not the day you need it.
The first two take a minute each. The third takes an hour and is the difference between a recoverable lab and a lost one.